There are countless media reports on changes to global food prices and most are based on monthly data released by the Food and Agriculture Organization of the United Nations (FAO). Specifically, they refer to changes in the FAO Food Price Index (FFPI). The FAO Food Price Index is a measure of change in international prices of a basket of five different food commodities. Officially, the FPPI was introduced in 1996 but the organization has calculated the annual FFPI backwards to 1961. Monthly data exists from 1990 onwards so most analyses focus on reports after 1989.
From a top line perspective it’s pretty simple: when there’s an increase in ag commodity prices then consumers can expect an increase in the price of food throughout the supply chain. So most industry professionals focus on the headline data reported in FFPI reports and aren’t all that familiar with the nitty-gritty details that go into producing the numbers released.
The FFPI is formulated using a statistical formula called the Laspeyres price index. It’s objective is to track prices over time against a “base year” where the base year is set at 100. While the technicalities that go into the construction of the FFPI, the resulting number is a variation off of 100. So when the index is greater than 100, it implies that the prices have risen and if the index is less than 100, it implies that the prices have fallen. Periodic revisions to the formula of the FFPI are necessary to ensure its relevance. Revisions help the index compare “apples-to-apples” over a long period of time. The last major revision to the FFPI was in July 2020.
The FAO Food Price Index is actually an “index of indices” as it tracks prices of a basket of five commodity group prices. The indices are weighted in an attempt to reflect each products relative importance in the overall global commodity market. The five commodity groups tracked are:
Meat Prices – According to an index that is computed from average prices of poultry products, meat products (bovine), pig meat products and sheep meat products (ovine). Computation of the meat index includes 27 different price quotations and can be complicated; the meat index is affected by estimates and revisions more than the other indices.
Dairy Prices – According to an index that consists of butter, skimmed milk powder, whole milk powder and cheese prices.
Cereal Prices – According to an index that combines the relative prices (as indicated by various other indices) of sorghum, wheat, corn/maize, rice and barley prices.
Vegetable Oil Prices – According to an index comprised of an average of 10 different vegetable oils
Sugar Prices – An index of the International Sugar Agreement price
The FAO also maintains the Global Food Consumption Price Indices (FGFCPI), which include the same prices as the FFPI, while incorporating fish and oilseed prices.
Are ag commodity prices at an all time high?
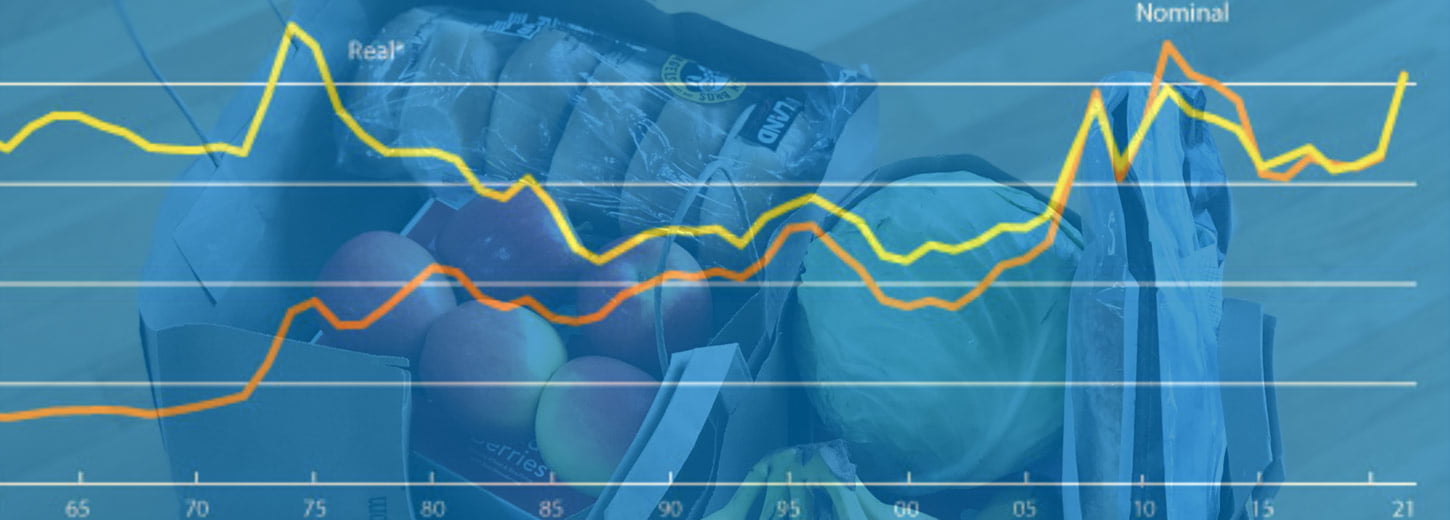
The FAO calculates the index monthly and annually and reports both nominal values and real values. Many media reports pin 2011 as the all time high for the index however they usually refer to the nominal values reported. Nominal values are the current monetary values while real values are adjusted for inflation and show prices at constant prices. Real values provide a better picture as to what consumers can actually buy.
When looking at the data annual real data 2021 prices were higher than in 2011. In 2011 the FFPI real value was at 118.8 – in 2021 it was 125.1 which was a nearly 27% increase over 2020. For comparison’s sake the FFPI’s value was 76.3 in 1990.
Comparing annual data from 1990-2021 here’s when each of the categories hit their highs in real values
Meat Price Index: The meat index hit a high of 107.3 in 2021
Dairy Price Index: hit a high of 128.7 in 2008
Cereal Price Index – hit a high of 133.9 in 2008
Vegetable Oil Price Index – hit a high of 164.0 in 2021
Sugar Price Index: hit a high of 145.0 in 2021
Some helpful resources: